Proposal Detail Reports
Review our video overview of the most common ways to export reports and data (3m12s).
First, we will review how to export the visuals and accompanying tables. This is ideal for sharing the dashboard document with colleagues or inserting the graphs into presentations. After the dashboard is filtered the way you would like to download it, click the Export button in the top toolbar.
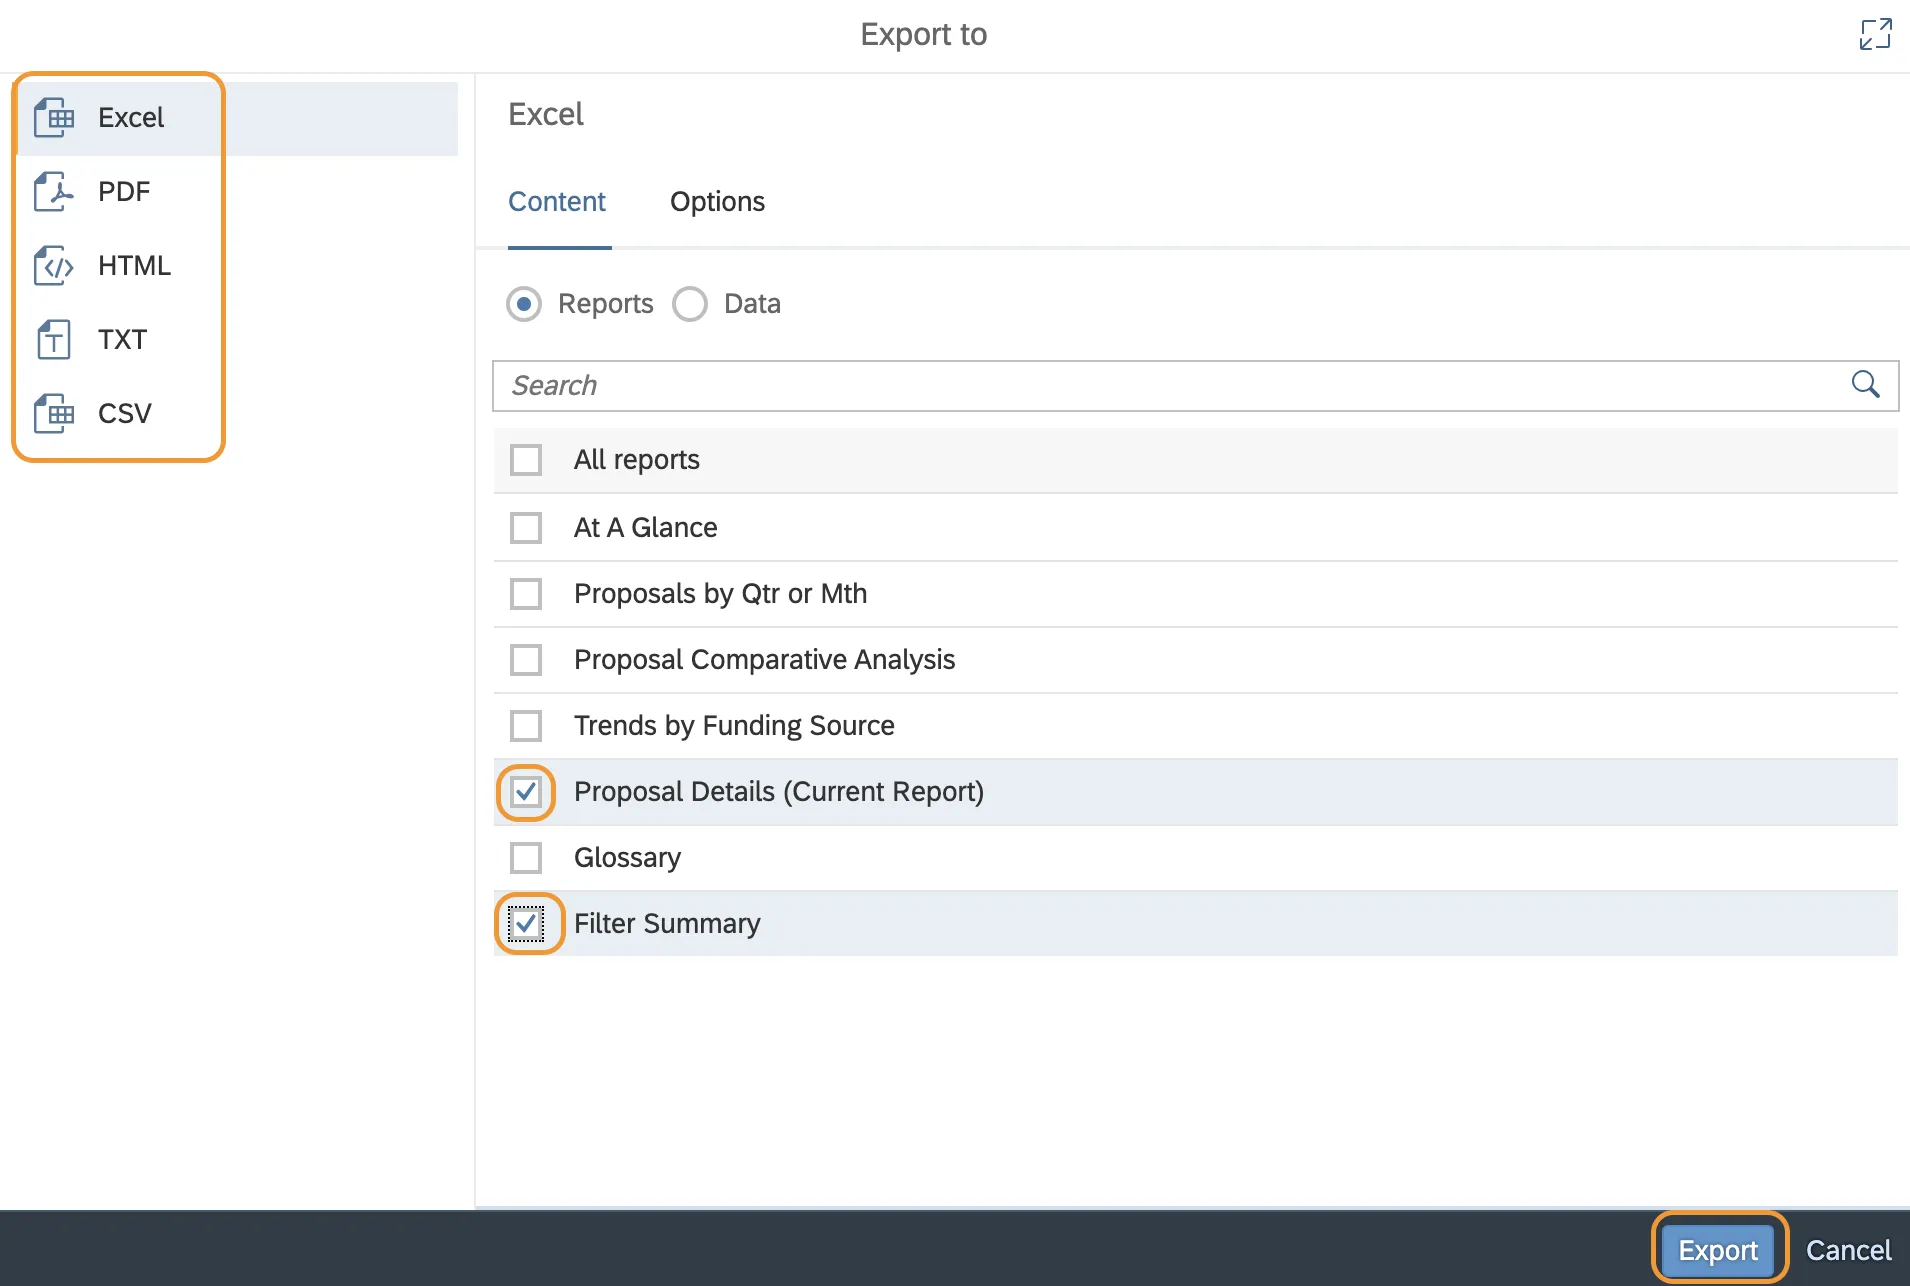
Next, select the type of file that you would like to export from the left – Excel is ideal if your goal is to extract the visuals for use in another document. Then, check the boxes for the reports that you would like to include in your export. It is a best practice to always include the Filter Summary so you have a recap of the parameters of your dataset – for example, if you have filtered the dashboard to show only specific fiscal years, or certain departments or sponsors. We suggest not including the Proposal Details tabular report and Glossary if you are exporting as a PDF or if you would like a concise document. Finally click export. Your downloaded file should appear in your browser downloads.
If you are interested in ‘slicing and dicing’ the tabular data from the Proposal Details tab in Excel, you can omit the other tabs except the Proposal Details and the Filter Summary. Alternatively, a companion report called “Expanded Proposal Details by Submit FY'' has been designed to be even more export- and Excel-friendly, and it does not have visuals, just the data. The “Expanded…” report is just like the Proposal Details tab, except that it includes additional columns of data about each proposal, such as title. Access this report directly from the Research Leadership public folder, or by clicking this link on the Proposal Details tab in the RLDD visuals report.
From the Expanded report, after entering your prompts and running the report, then again you can click the export button in the top toolbar and then click “All Reports” so you can include the Filter Summary so you can be sure to know the data parameters. Finally click export.
To return to the research dashboard, you can click the arrow next to the document title at the top.
For more information, visit www.rldd.research.columbia.edu/data-reports
You can review and download the underlying data from the dashboard in a variety of ways:
The Proposal Details tab includes a table with 30+ columns that provide details for each of the proposals represented in the visuals you see in the other dashboard report tabs. To see other pages in the table, scroll to the bottom and mouse over the bottom-middle of the screen and Go to buttons will appear, allowing you to see subsequent pages.
Note: The data in this table is affected by the choices you make in both the prompts and the input controls in the filter bar.
Download the Proposal Details report
- Click the Export button in the top toolbar (downward-pointing arrow in the upper-left area).
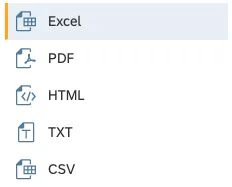
- Select the type of file you would like to export the data in from the left-hand panel (Excel, PDF, etc.).
- Check the box for Proposal Details from the list (you can check others if you would like other dashboard tabs/reports to be included in your download).
- Recommended: Check the box for the Filter Summary so your download will include the parameters of the data you have downloaded (e.g. fiscal years included, any departments or PIs selected, etc.)
- Click Export.
The Expanded Proposal Details by Submit FY report includes a table with ~50 columns that provide details for each of the proposals represented in the visuals you see in the other dashboard report tabs.
Open the Expanded Proposal Details by Submit FY report
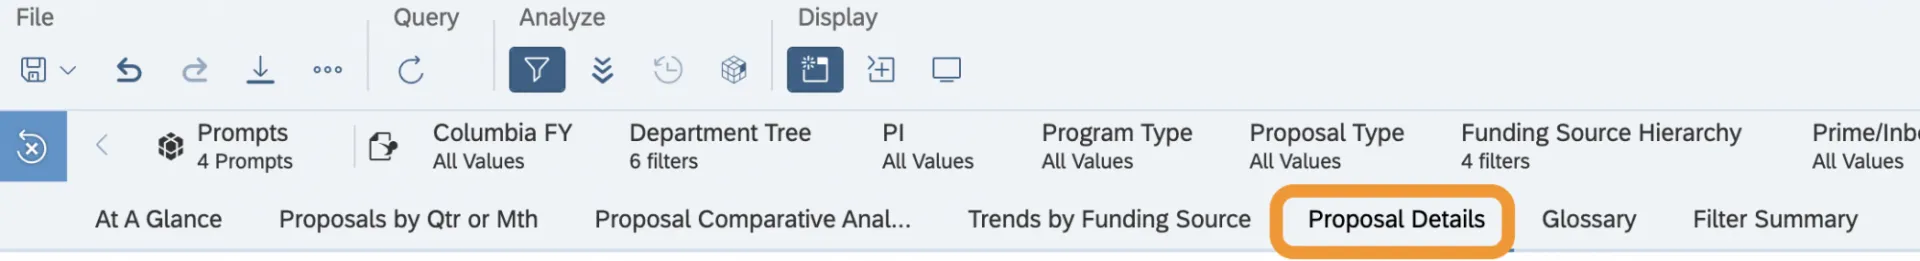
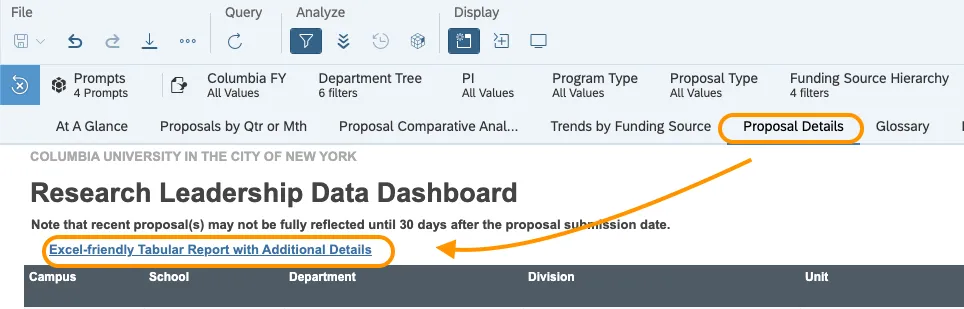
- Navigate to the Proposal Details tab from the top toolbar.
- Click the Excel-friendly Tabular Report with Additional Details link above the table.
- A new window will open within the platform displaying the prompts screen. Make your Fiscal Year selections (required) and any other parameters you would like to refine the report by.
- A new tabular report will be displayed. To see other pages in the table, scroll to the bottom and mouse over the bottom-middle of the screen and Go to buttons will appear, allowing you to see subsequent pages.
- You can also refine the information displayed in the report by using the input controls (Columbia Fiscal Year, Department Tree, Program Type, etc.) in the top toolbar.
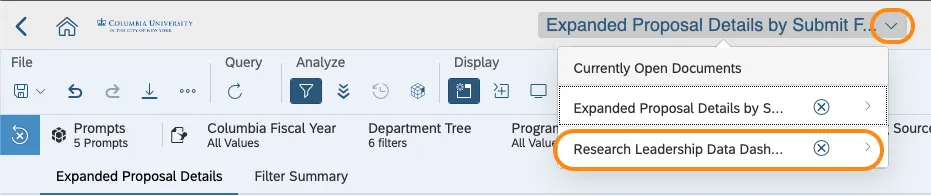
- To return to the dashboard, click the < arrow in the top-right corner. You can also click the drop-down arrow at the very top of the screen to see a list of all currently open documents, and select Research Leadership Data Dashboard.
Download the Expanded Proposal Details by Submit FY report
- Click the Export button in the top toolbar (downward-pointing arrow in the upper-left area).
- Select the type of file you would like to export the data in from the left-hand panel (Excel, PDF, etc.).
- Check the box for Details from the list.
- Recommended: Check the box for the Filter Summary so your download will include the parameters of the data you have downloaded (e.g. fiscal years included, any departments or PIs selected, etc.)
- Click Export.
- To return to the dashboard, click the < arrow in the top-right corner. You can also click the drop-down arrow at the very top of the screen to see a list of all currently open documents, and select Research Leadership Data Dashboard.
The visuals (graphs) and their accompanying tables throughout the dashboard can be downloaded, allowing you to easily circulate the dashboard document to colleagues or insert the images in presentations.
Note: The visuals will be exported in their current state, depending on your latest choices in both the prompts and the input controls in the filter bar.
Download the dashboard's visuals
- Click the Export button in the top toolbar (downward-pointing arrow in the upper-left area).
- Select the type of file you would like to export the data in from the left-hand panel (Excel, PDF, etc.).
- Check the boxes for reports (tabs) that you would like to have included in your export from the list.
- Recommended: Do not include the Proposal Summary Report or Glossary if you would like a concise document.
- Recommended: Include the Filter Summary so your download will include the parameters of the data you have downloaded (e.g. fiscal years included, any departments or PIs selected, etc.)
- Click Export.
What's included in RLDD data extracts?
FAQ
You cannot sort or filter a column directly within the Proposal Details tab. You can use the input controls to filter the data so fewer results are displayed, or you can export the table to Excel and add a filter there to do your sorting.
When you click on the Excel-friendly Tabular Report with Additional Details link, it will open a new report called Expanded Proposal Details by Submit FY. To navigate back to RLDD, you can click the down-arrow at the top of the page to display all open reports. Then click on Research Leadership Data Dashboard.