Proposals by Qtr or Mth
This section contains a visual and a table that help examine proposal submission behavior quarter-over-quarter, and can also be drilled down to month-over-month. The section was designed to help you answer the following questions:
- Which months of the year historically have the most proposal submissions for a given unit? what times of year do we need to prioritize support and attention for this unit?
- How many proposals have been submitted so far to date this quarter (or month)? How does that compare to the same quarter (or month) in previous fiscal years?
- How much money was requested this year to date? How does that compare to the same quarter (or month) in previous fiscal years?
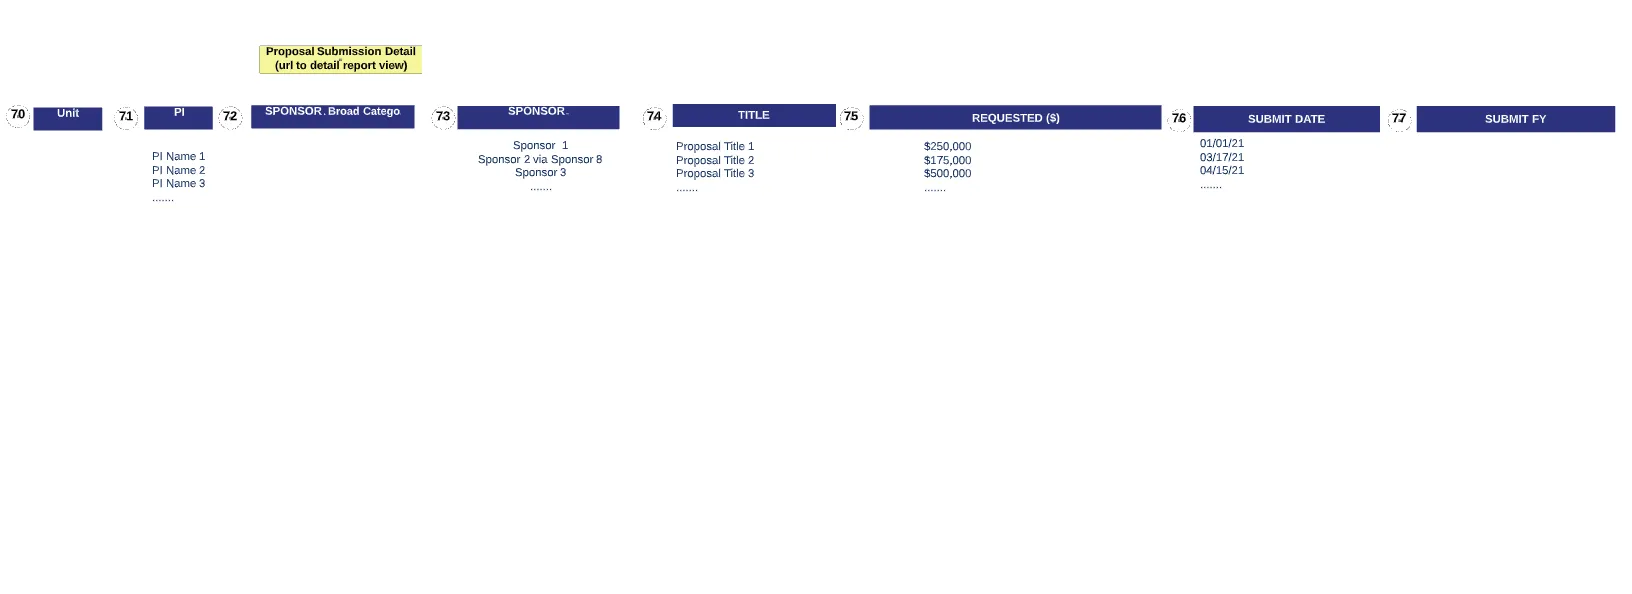
Visuals
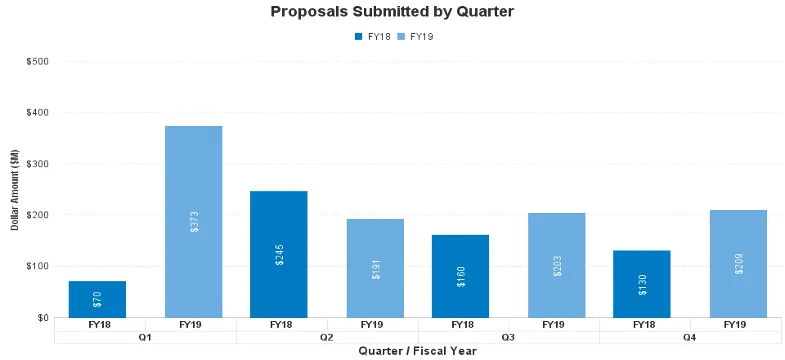
This visual shows a detailed view of the 'Proposals by Fiscal Year of Submission' visual on the At A Glance tab. Here, the total dollar amount or number of proposals by the fiscal year of submission can be viewed across months or quarters within one or more fiscal years. The table below displays corresponding proposal details.