Quick Start Guide
"Reading the Quick Start Guide can save hours within the first two weeks of using the dashboard."
-- A New RLDD Super-User
Log in
- Always use the Login Button on the RLDD Home page, unless you are already a customer of Enterprise Reporting for other reports (e.g. FDS, HRIS Management Reports).
- Bookmark our home page and NOT the login link itself. The link url may change in the future and thus break if directly bookmarked, while our homepage login link will be current at all times.
- If you are already accustomed to accessing Enterprise Reporting via other means, you may feel free to use other methods to get to the same place pictured below with the RLDD now a part of your existing reporting portfolio.
- Once logged into Columbia's Enterprise Reporting space,
- Navigate to the report via: Folders > Public Folders > Research Leadership
- If you do not see the "Research Leadership" folder in public folders, then you still need to request access.
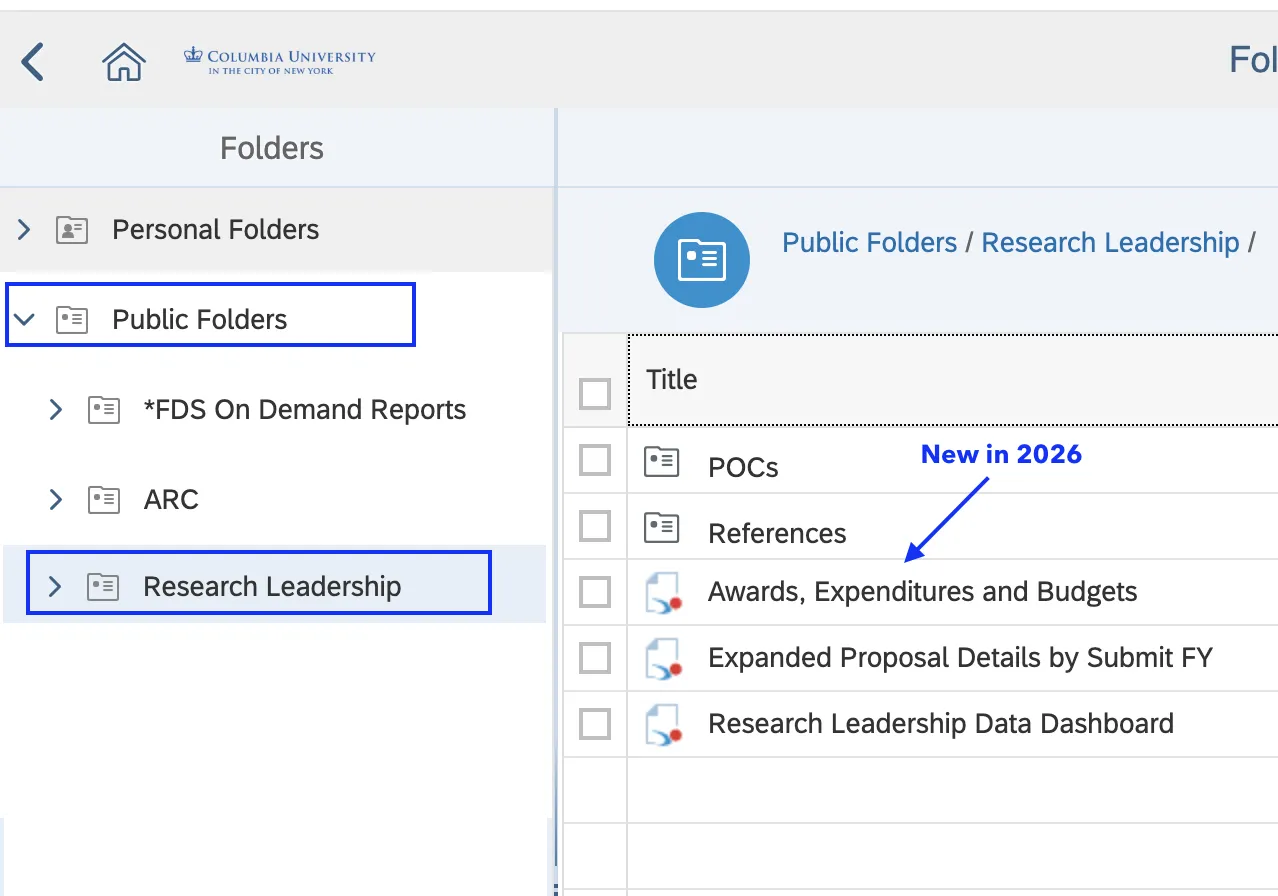
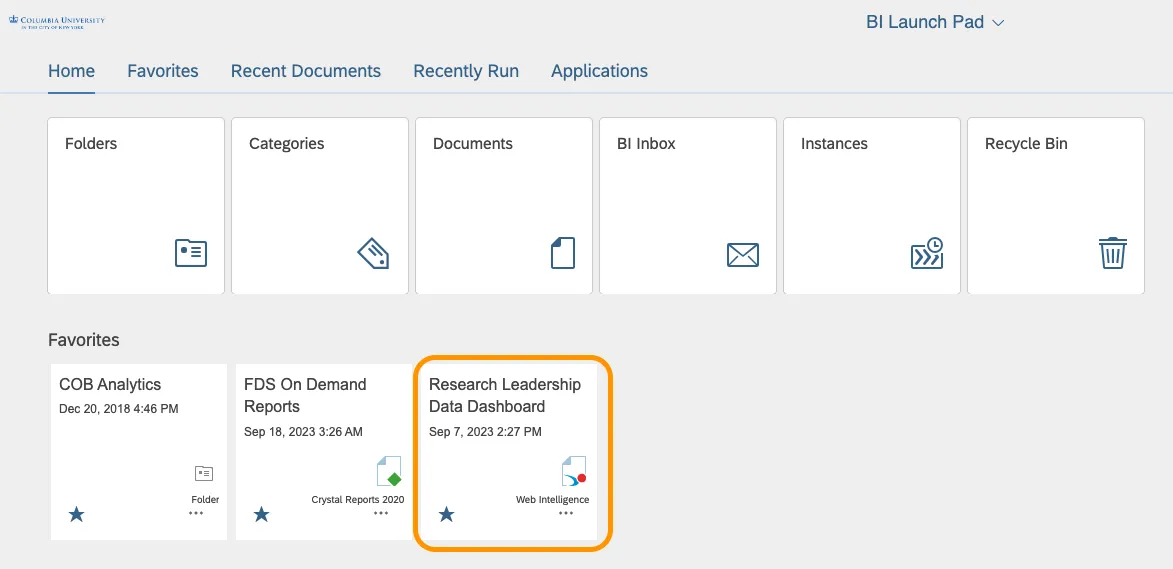
You may choose to "Favorite" the folder, or one or more of the reports, after which you may see Research Leadership Data Dashboard or Awards, Expenditures and Budgets tile along with your other "Favorites" in the middle of the page.
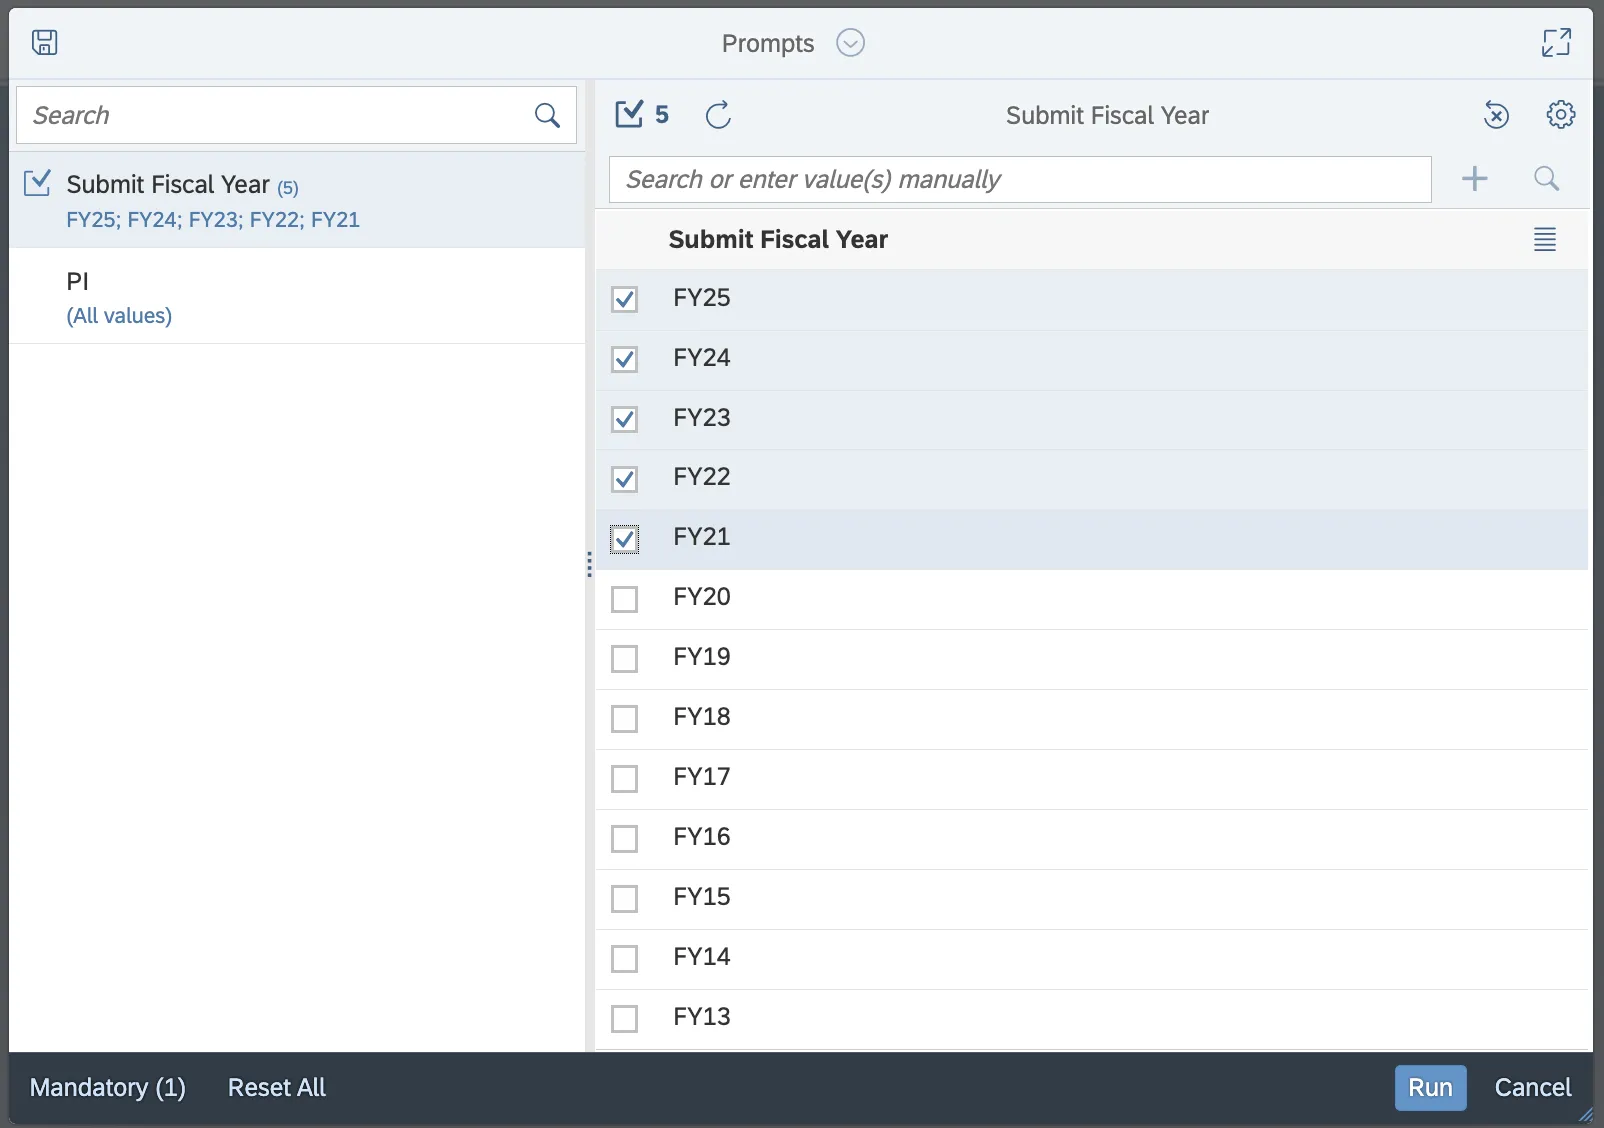
Set Prompts
Prompts dictate the data that is pulled into your dashboard (they can always be reset); since you can further filter data inside the dashboard, we recommend that you typically use only the Fiscal Year prompt for the time frame you are seeking.
- "Submit Fiscal Year" (Required): Check the boxes for the Submit Fiscal Years that you would like represented in your dashboard visuals and detail data. (A maximun of four at a time is recommended to start with.)
- "PI" (Optional): Principal Investigator selection by name.
- To select from the optional prompts, choose it from the left sidebar and click the Refresh arrow button to see available data as a list Note: You will be able to refine the Department and Funding Source selections with easy-to-use filters (explained below) after you have loaded all the dashboard data your security access allows. Therefore, we recommend that you leave these optional prompts blank until you have worked with the reports frequently.
- Click Run.
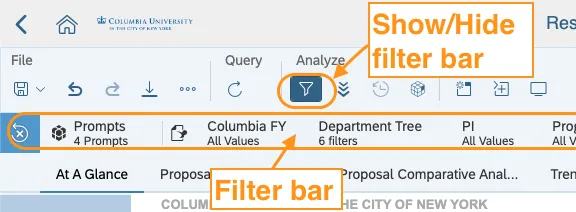
Filter Data (Slice and Dice) while in the Dashboard
The filter bar spans the top of the screen and contains a range of what we call "input controls" in WebI. You can use these to refine the data that you see in the visuals and tabular reports.
- If you do not see the filter bar, then click the filter button under Analyze: to display it. (After this action, it should show each time you load your dashboard. If this does not happen for you, please submit feedback.)
Review Visuals and Data
- The visuals (graphs) are sorted into four "reports" (tabs) that are located directly above the visuals
- Other reports include:
- Proposal Details with 30+ columns displaying detailed information for all of the current data (based on the input controls you have selected).
- Expanded Proposal Details with 55+ columns of data
- Glossary containing definitions for key terms used throughout the dashboard.
- Filter Summary recapping all of the current selections on the prompts and the input controls in the filter bar.
- Proposal Details with 30+ columns displaying detailed information for all of the current data (based on the input controls you have selected).

- Use the left and right arrows to see all of the available input controls.
- Some input controls are only available on certain report tabs (these will be at the far right).
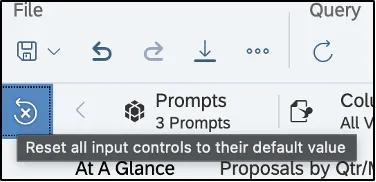
- You can remove all input control selections by clicking the Reset button at the far left of the filter bar. This will bring you back to the data loaded from your initial prompt selection.
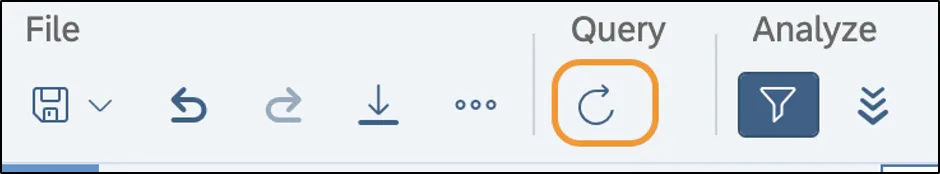
Reset Prompts
If you'd like to change your prompt selections after you are in the dashboard, click the arrow button below Query in the menu bar.
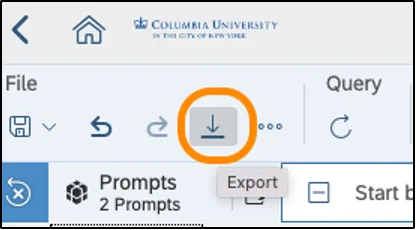
Export Data
You can export visuals as PDFs or Excel documents, and data as Excel or CSV documents via the Export button (down arrow) in the Menu bar.
- Click the Export button in the top toolbar.
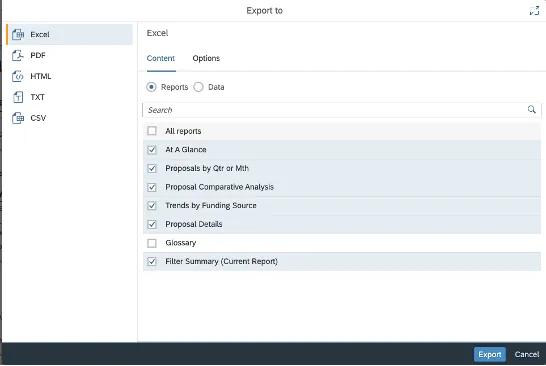
- Select the type of file you would like to export the data in from the left-hand panel.
- Keep the radio button on Reports.
- Check the boxes for the tabs you would like included in the downloaded file. It is strongly recommended to always include Filter Summary so you can have a recap of the data included in the download.
- Click Export. The file should download within moments.
Corresponding ARC Levels for Proposal Department Tree
Create Custom Prompt Variants
Custom prompt variants allow you to save frequently-viewed parameters to expedite loading the dashboard (for example, FY20-FY23 for ENG Computer Science 521300X and ENG Electrical Engineering 521400X). You can save as many views as you need.
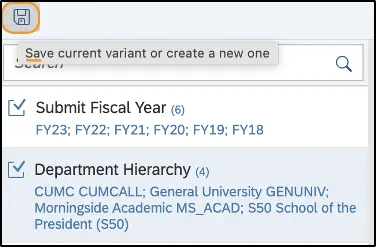
- Set your desired Prompt parameters for Fiscal Year and Department Hierarchy. Do not click Run.
- Click the Save icon in the upper-left corner to save your custom prompt.
- Name your prompt variant with a descriptive title. Once you have named your view, click Save.
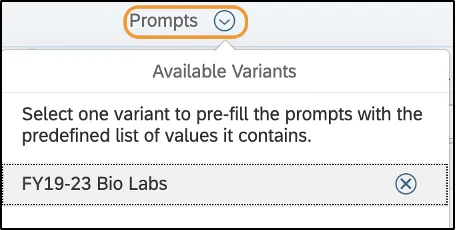
- To use your prompt variant, click the drop-down arrow next to the Prompts at the top of the window; click on the prompt variant you want, and click Run.