Trends by Funding Sources
This report contains five visuals that allow you to examine funding trends through different lenses: proposals, awards, expenditures, success (awarded or not), and yield. The visuals are designed to help you answer these questions:
- Which funding sources receive the highest number of proposal submissions?
- Which funding sources receive the "high dollar" proposals?
- Which funding sources receive the greatest overall percentage of proposal submissions?
- Which funding sources award the most money?
- Which funding sources represent the largest overall percentage of awards received?
- How successful were my proposals to my top funding sources?
- Which funding sources were my most successful awards from?
- How consistent have my top funding sources been year-over-year?
- How much money that was requested was awarded by the top funding sources?
- Which top funding sources provided the most yield for requested amounts?
Visuals
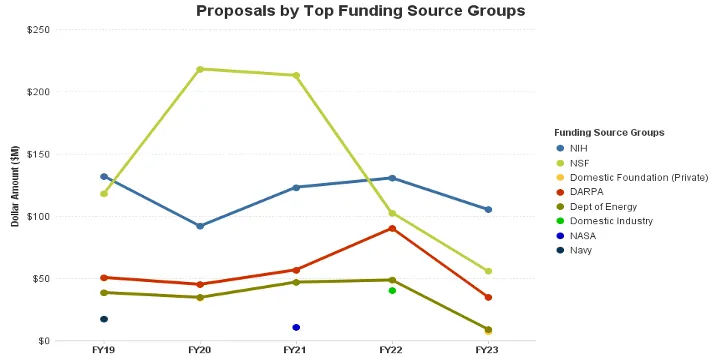
This visual shows the funding sources that received the most proposal submissions, by dollar amount or count of proposals, by the fiscal year of submission. (The top funding source groups per fiscal year.)
Note: The values in this visual show amounts or counts for the top funding sources only and may not reflect the dollar amounts or counts of all proposals for that year.
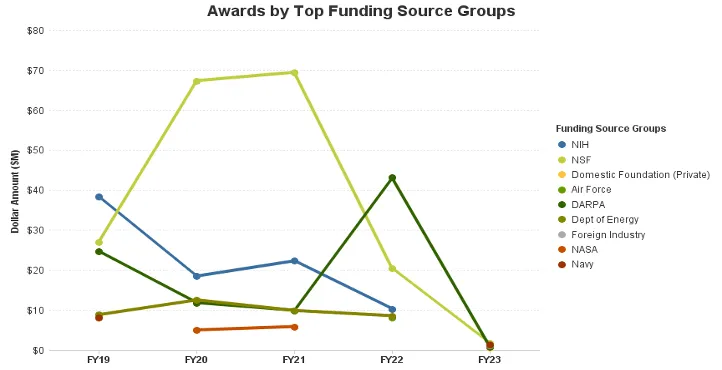
This visual shows the funding sources from which the most money was received, by dollar amount or count of awards, by fiscal year of award.
Note: The values in this visual show amounts or counts for the top funding sources only and may not reflect the dollar amounts or counts of all awards for that year.
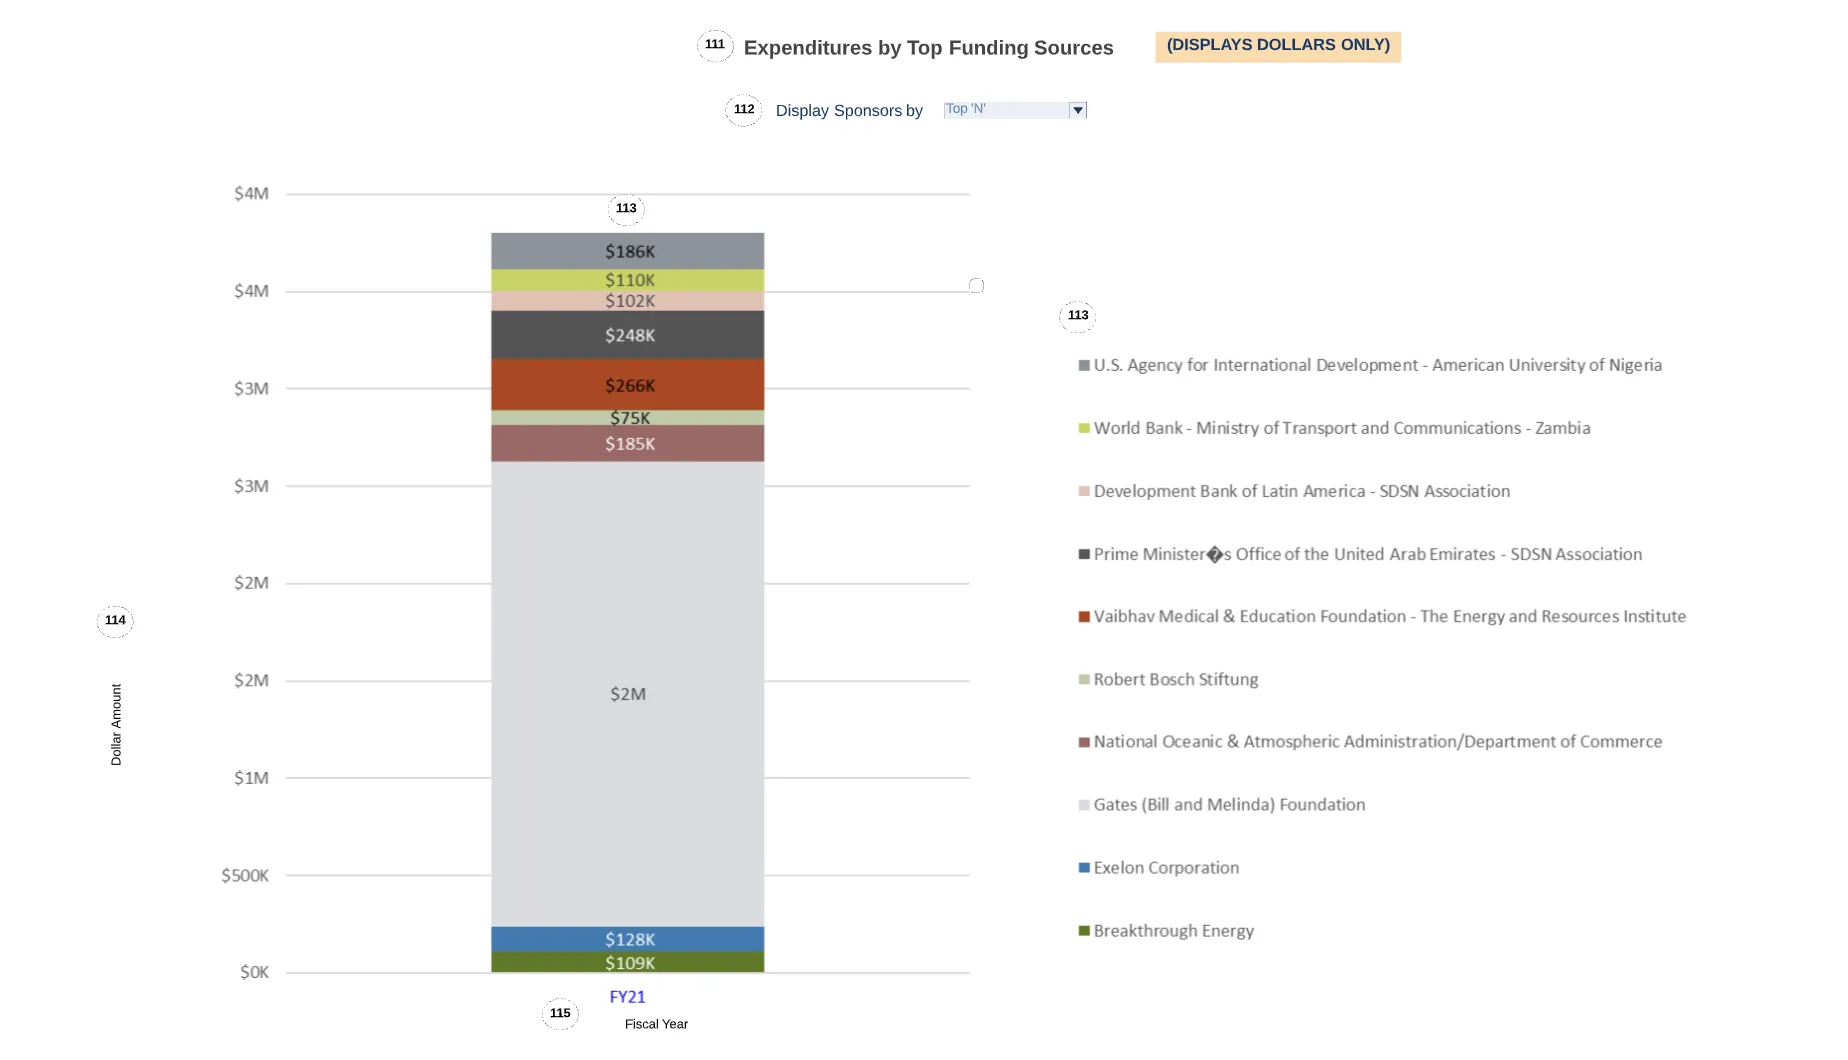
This visual shows the dollar amount of funding sources to which the most spending is attributed, by the fiscal year of expenditure.
Note: The values in this visual show amounts for the top funding sources only and may not reflect the dollar amounts of all expenditures for that year.
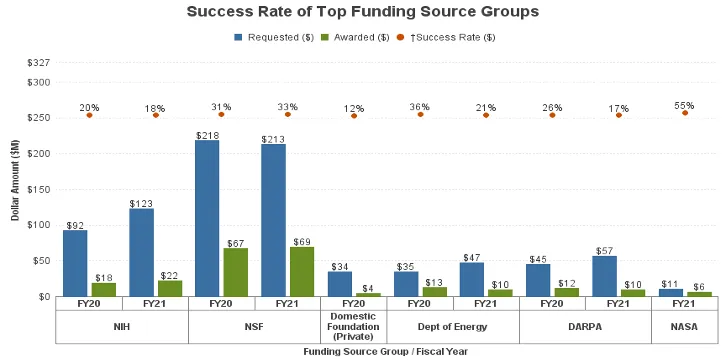
This visual shows the Success Rate of top funding sources, by dollar amount or count of Requested proposals, by the fiscal year of submission.
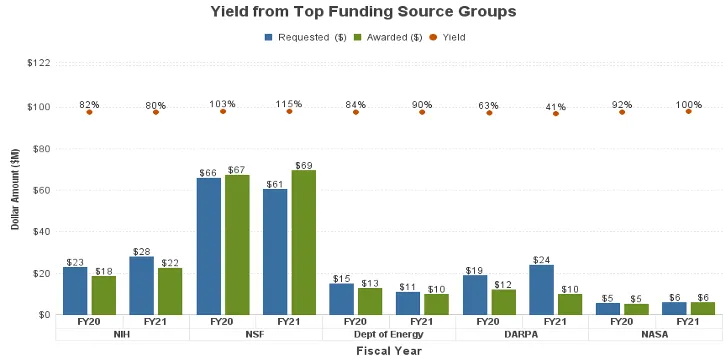
This visual shows the Yield from top funding sources, by the fiscal year of submission.