At A Glance
This report offers four visuals that provide an overview of current funds and spending, proposal success rate, and requested vs. awarded amounts. Further details surrounding proposals, funding source trends, and awards and expenditure are available in subsequent reports (tabs) of the dashboard (links at right). This report is designed to help you answer the following questions:
- How many proposals have we submitted so far this year?
- How much money have we requested so far this year?
- Compared to previous years, have we submitted more or fewer proposals this year?
- What is my year-over-year rate of change in proposal submission counts/dollars requested?
- How much money was awarded across all of the proposals submitted in a given year? how much is still pending?
- How does my success rate last year compare with previous years? is there an overall trend for the past X years?
- For successful proposals, how do the dollars awarded compare to dollars requested in a given year? is there an overall trend for the past X years?
Visuals
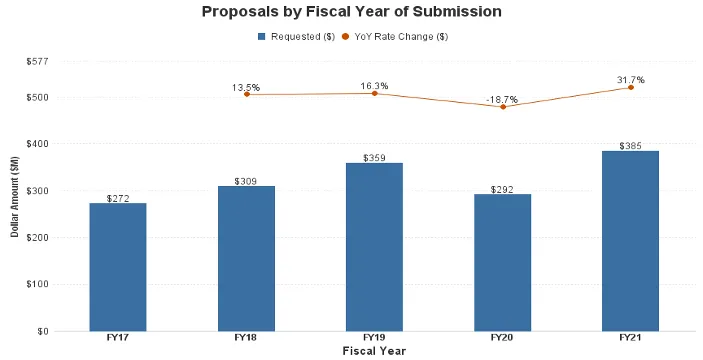
This visual displays the total dollar amount or count of proposals by the fiscal year of submission. The increase/decrease from the previous fiscal year is displayed as a percentage above each bar.
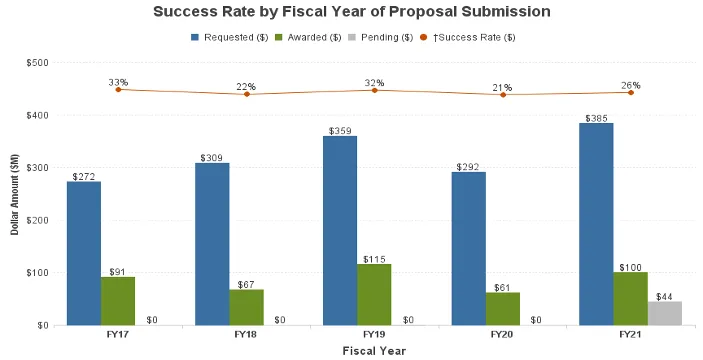
This visual displays the total dollar amount or count of proposals by the fiscal year of submission for the following categories: Requested, Awarded, and Pending. The trend line represents the overall Success Rate for what was Awarded compared to what was Requested by the fiscal year of submission. Requested ($) reflects the total dollar amount Requested for the entire project period. Awarded ($) reflects the total dollar amount Awarded and not what is authorized to spend in that fiscal year. Pending ($) reflects the total dollar amount of proposals that have been submitted and awaiting the Sponsor’s approval.
Note that a proposal's funding status may not be finalized until 18 months after submission.
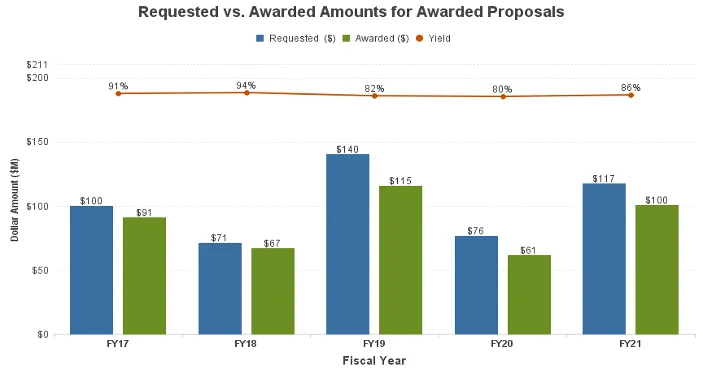
This visual shows the dollar amount of Awarded proposals by the fiscal year of submission in the following categories: Requested ($) and Awarded ($). Awarded ($) reflects the total award and not what is authorized to spend in that fiscal year. The Yield is the Awarded ($) as a percentage of the Requested ($) for such Awarded proposals.